This page features a curated collection of academic illustrations created by Toni Heittola, crafted to visually support and deepen understanding of topics related to DCASE (Detection and Classification of Acoustic Scenes and Events), specifically sound event detection, acoustic scene classification and general sound classification. These visuals are designed to clarify complex concepts and offer intuitive representations for both educational and scientific purposes.
Many of the illustrations have been developed over the years to support DCASE publications and tutorials, and form part of the visual material for my PhD thesis work. All figures are licensed under Creative Commons, allowing free use in presentations and publications. Feel free to use them, but please remember to provide proper attribution.
Analysis Task Descriptions

System input and output characteristics for three analysis systems: acoustic scene classification, audio tagging, and sound event detection.
Acoustic Scene Classification
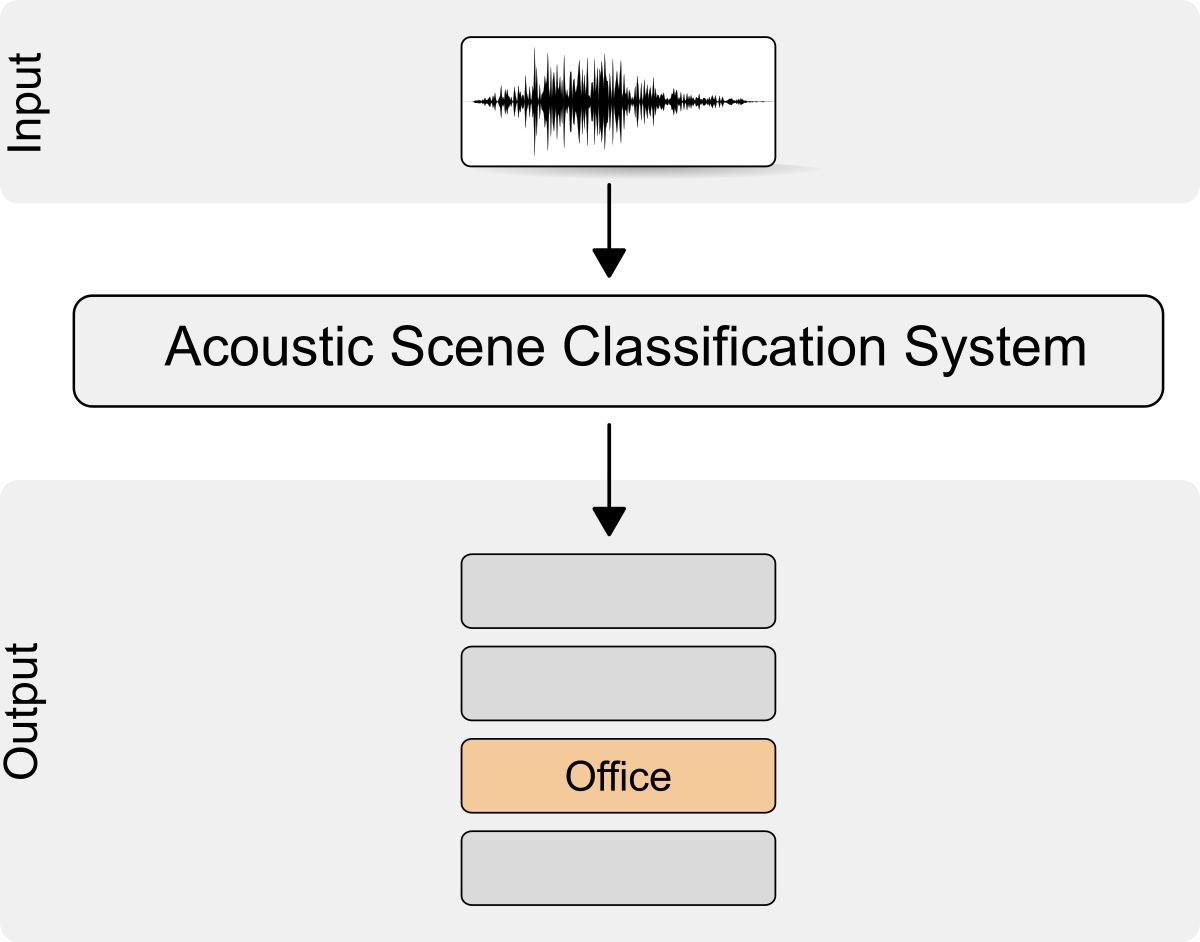
DCASE2018 Challenge Acoustic Scene Classification


Acoustic Scene Classification with Multiple Devices
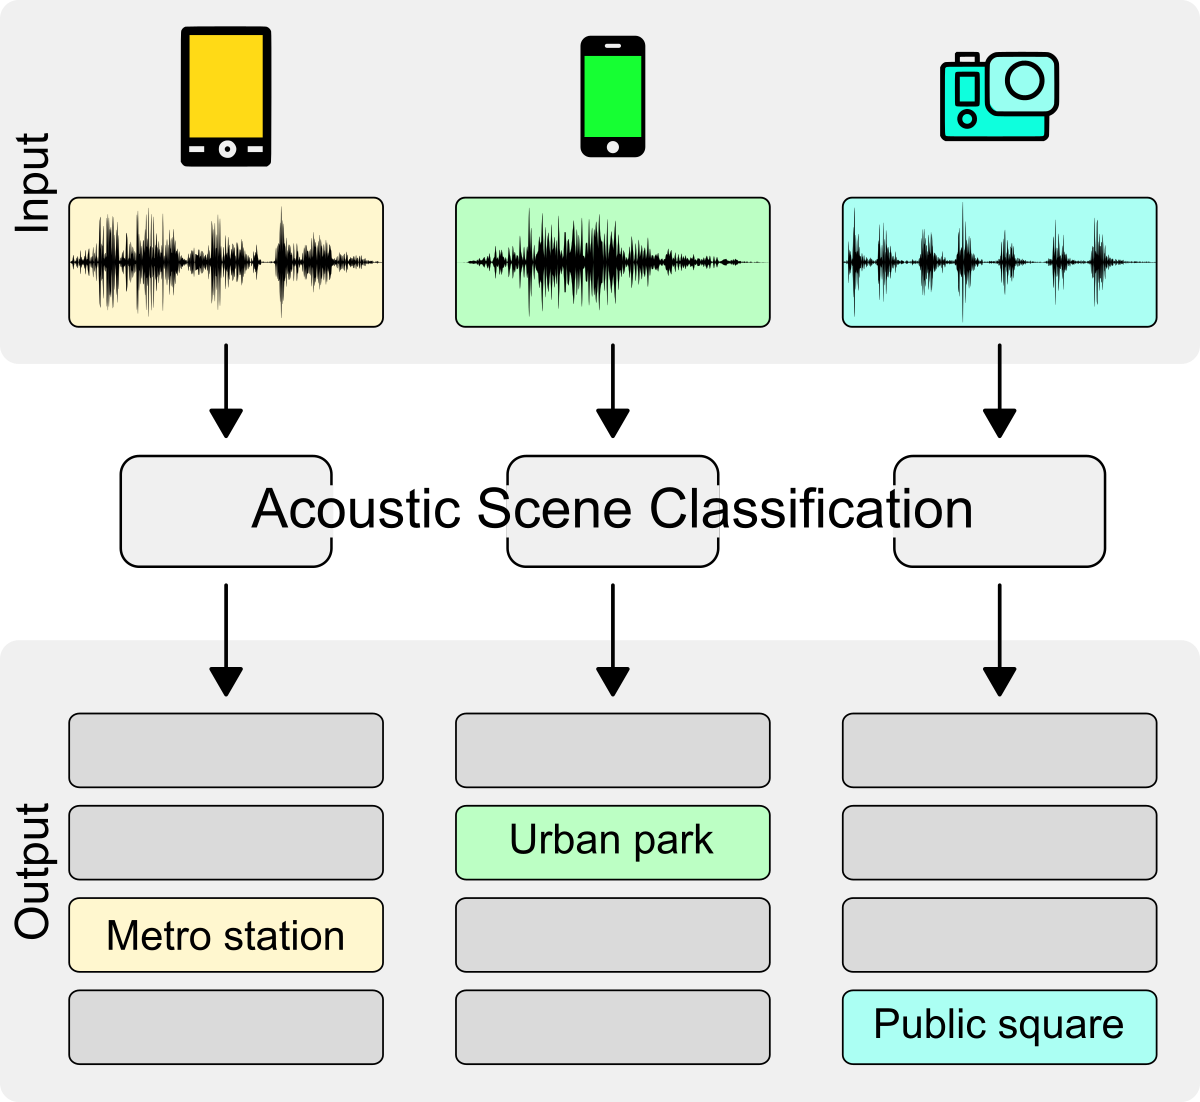
DCASE2020 Challenge Acoustic Scene Classification


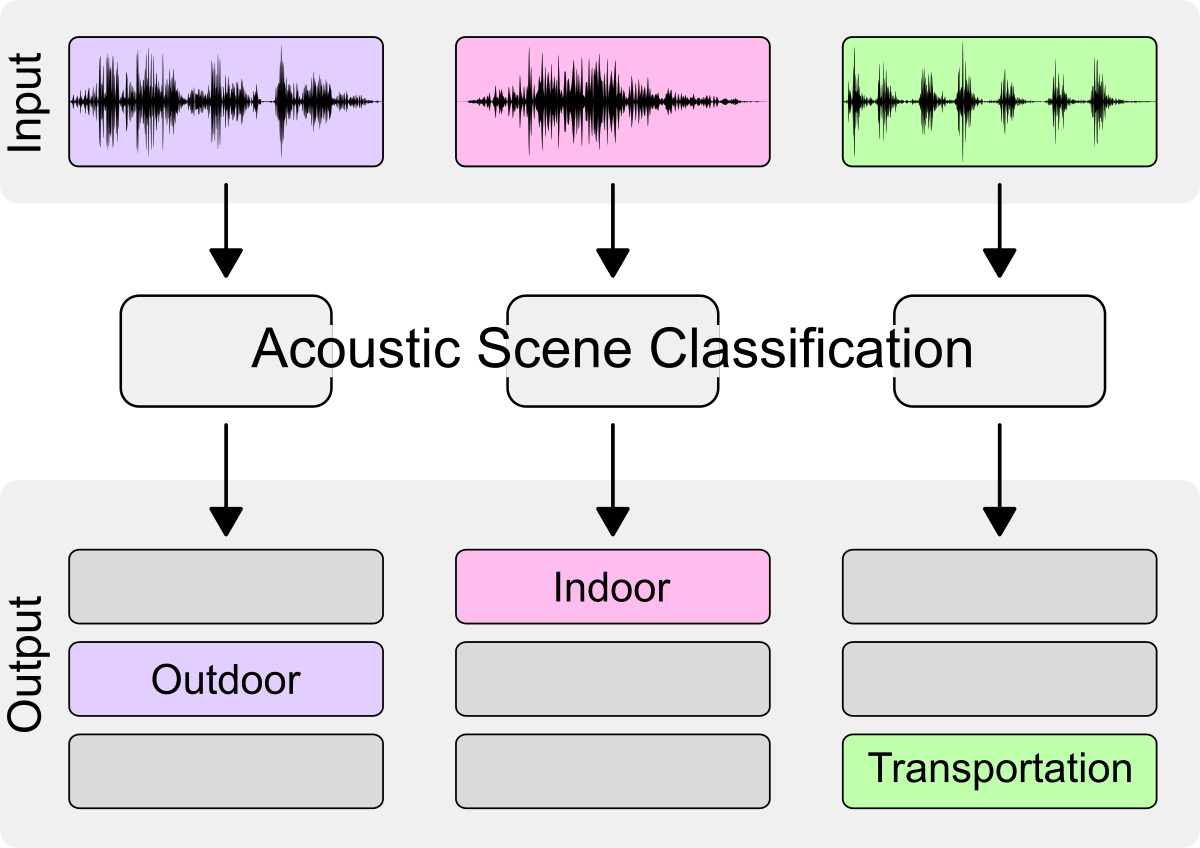
DCASE2020 Challenge Acoustic Scene Classification


Audio-Visual Scene Classification
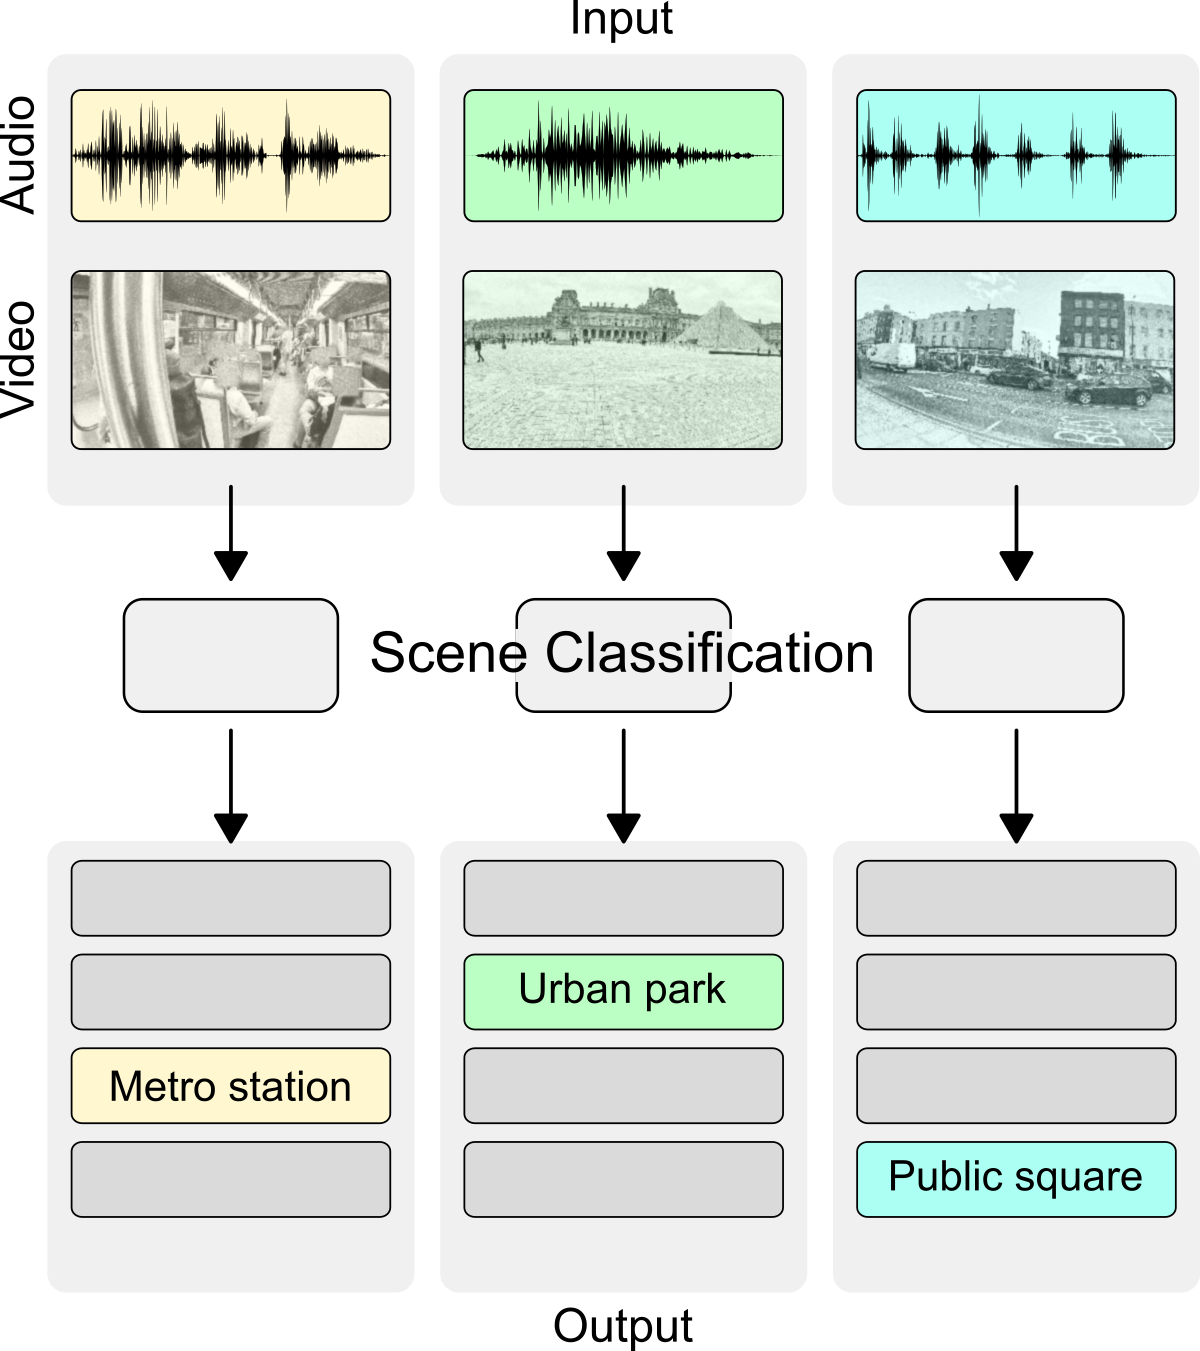
DCASE2021 Challenge Audio-Visual Scene Classification


Sound Event Detection
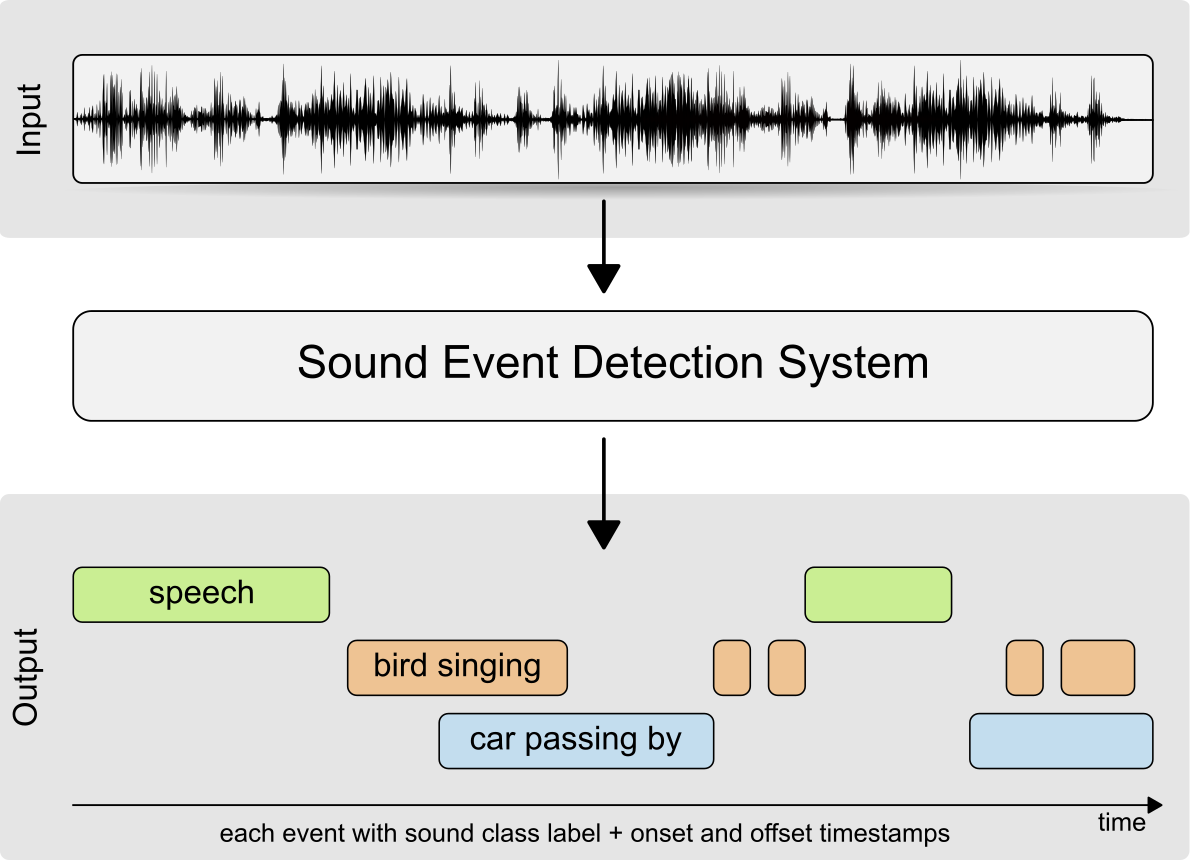
DCASE2018 Challenge Sound Event Detection
Audio Tagging
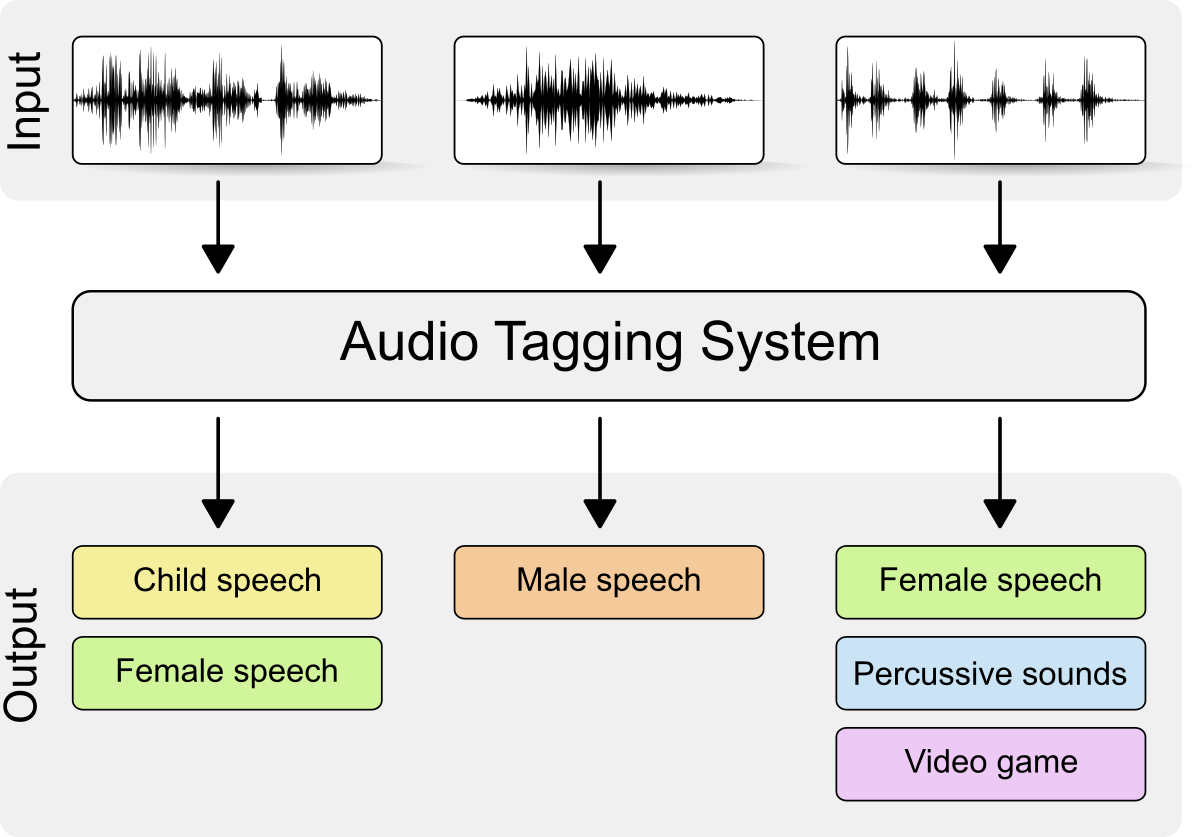
DCASE2018 Challenge Audio Tagging
Auditory Perception
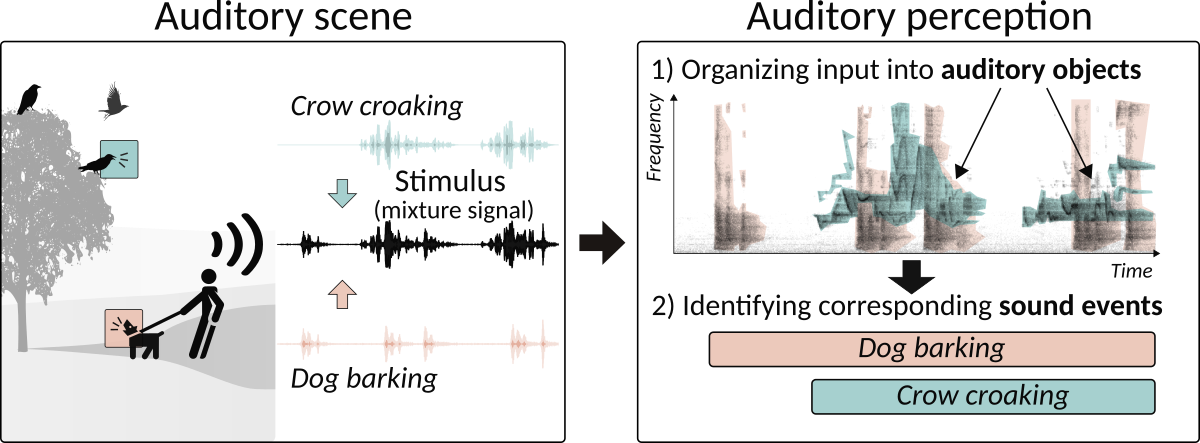
An example showing auditory perception in auditory scene with two overlapping sounds.
Annotation process
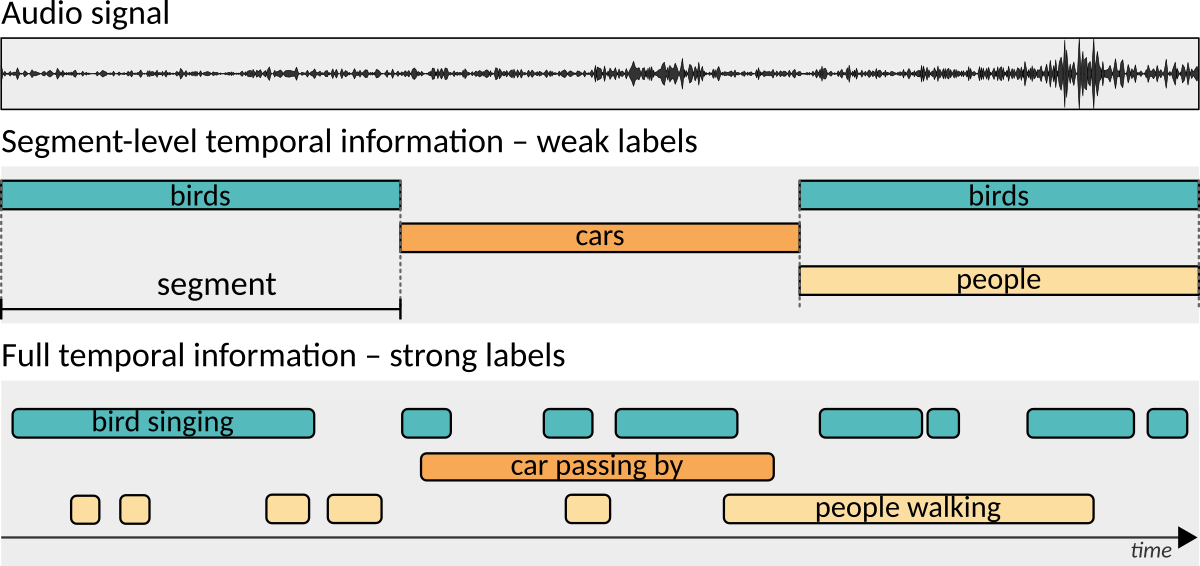
Annotation with segment-level temporal information and with detailed temporal information.
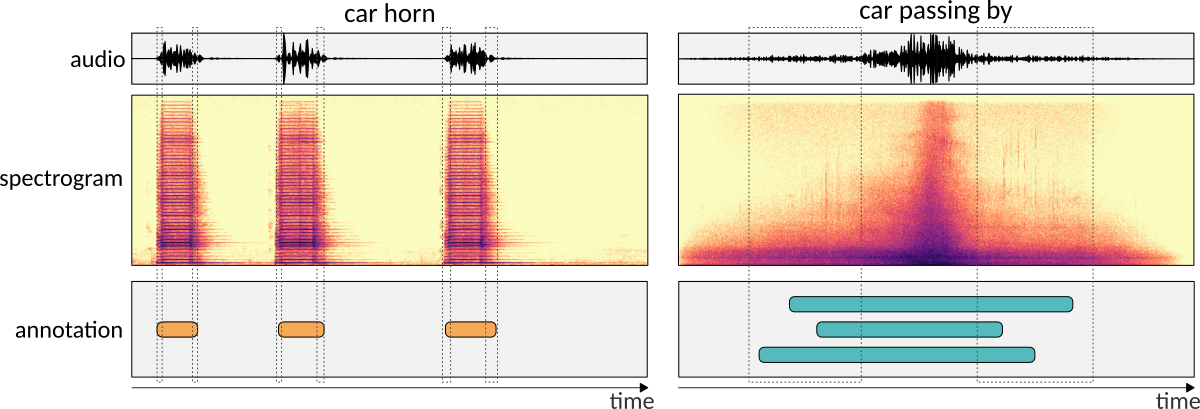
Annotating onset and offset of different sounds: boundaries of the sound event are not always obvious.
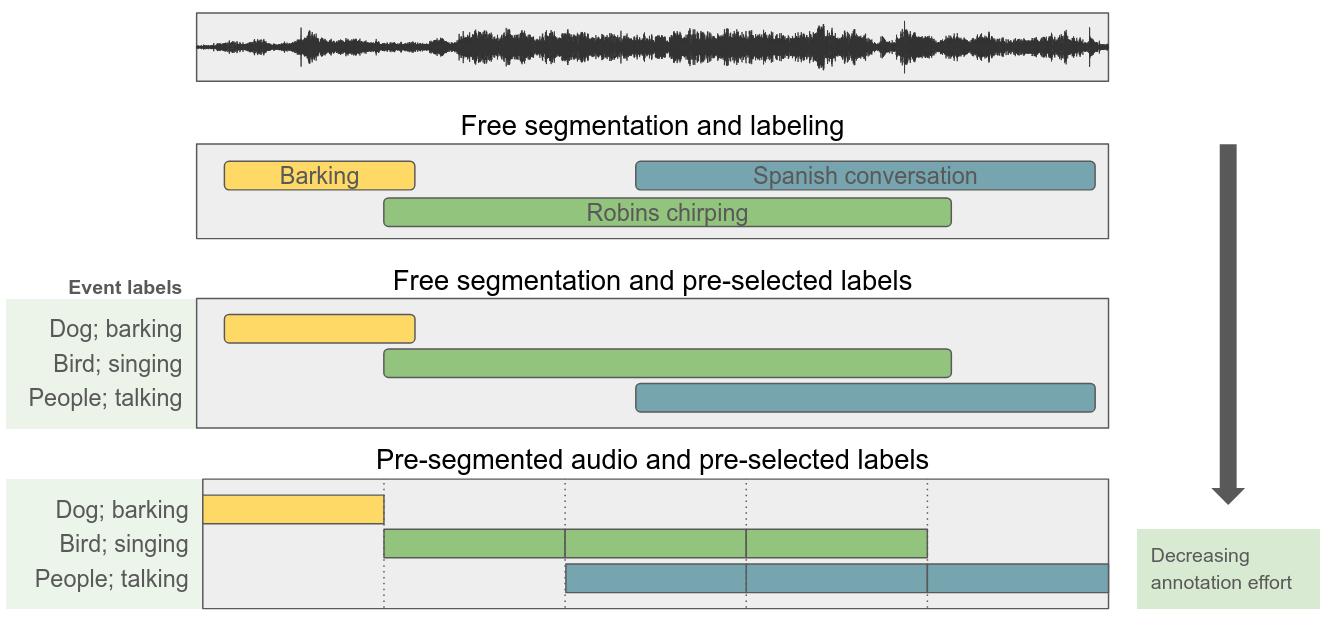
Types of annotations for sound events
Content analysis of environmental audio
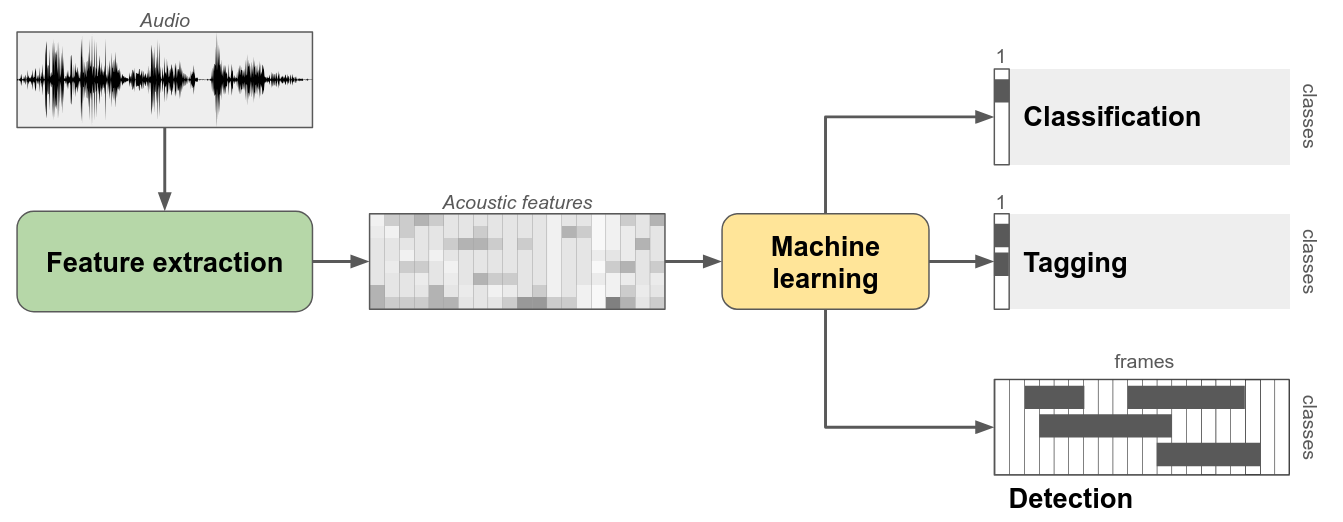
General machine learning approach

Examples of sound sources and corresponding sound events in an urban park acoustic scene.

Illustration on how monophonic and polyphonic sound event detection captures the events in the auditory scene.


The basic structure of an audio content analysis system.


Acoustic features
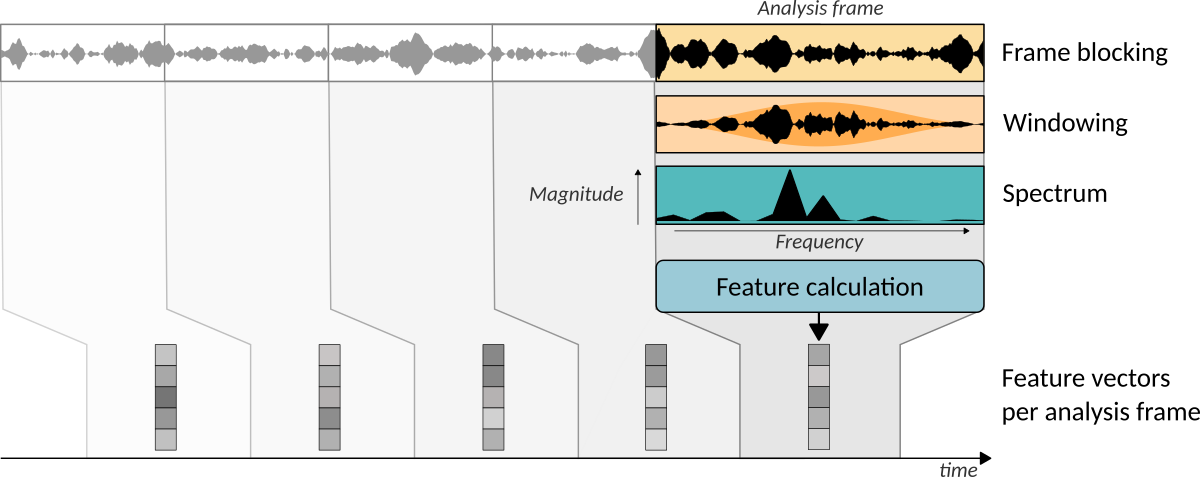
The processing pipeline of acoustic feature extraction.
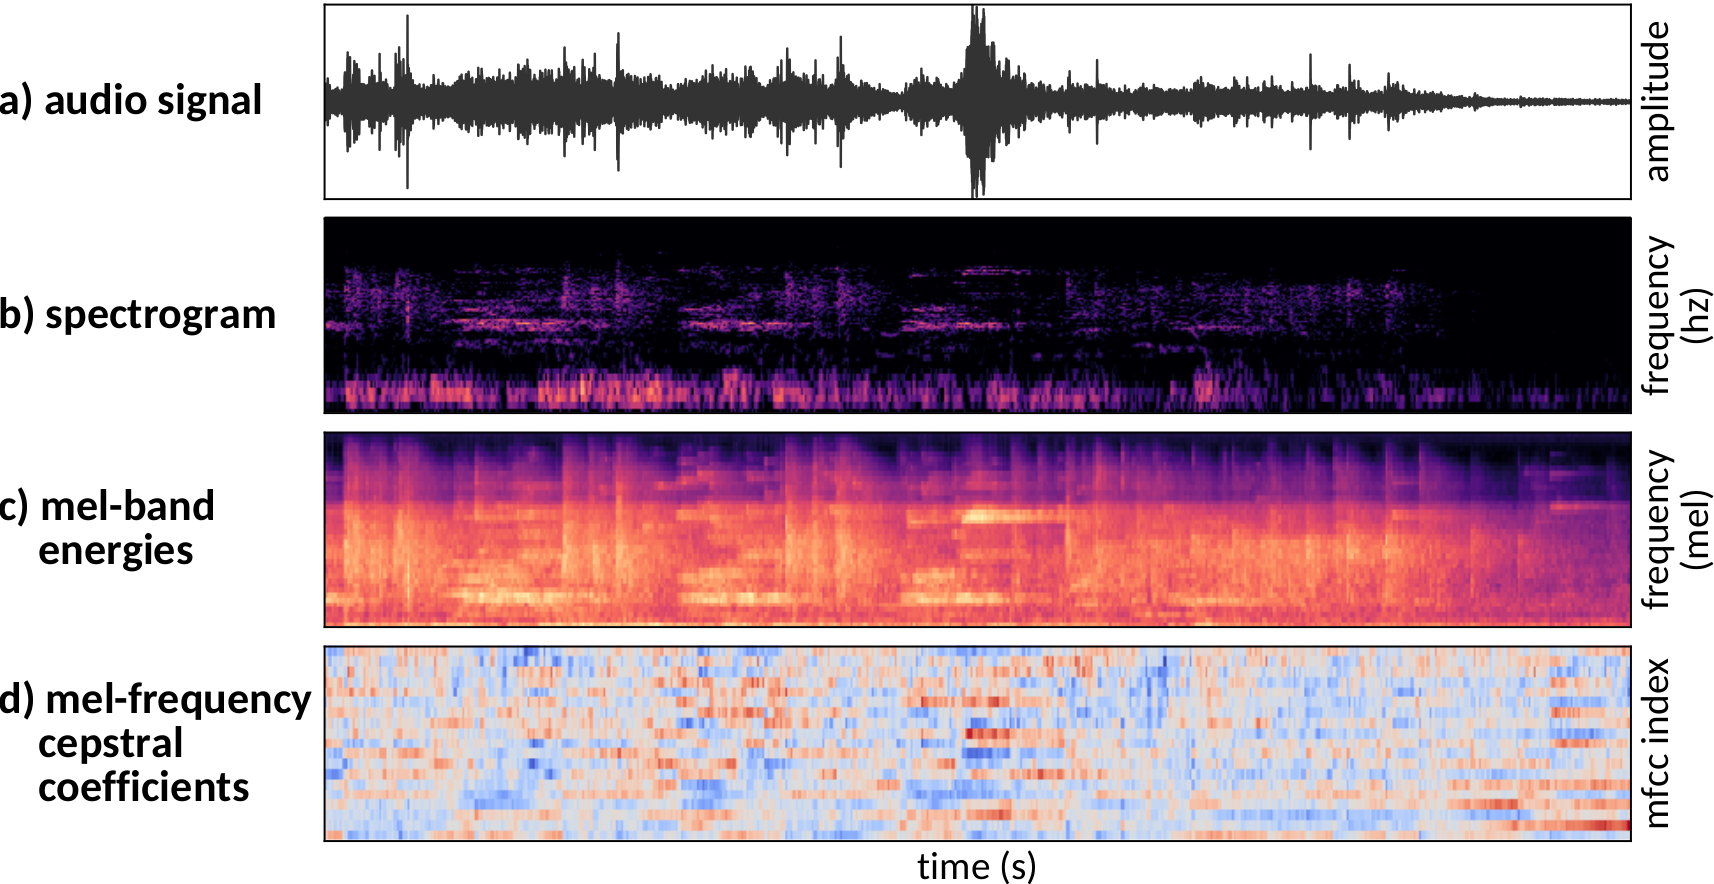
Acoustic feature representations.

Mel-scaling (top panel) and mel-scale filterbank with 20 triangular filters (bottom panel).
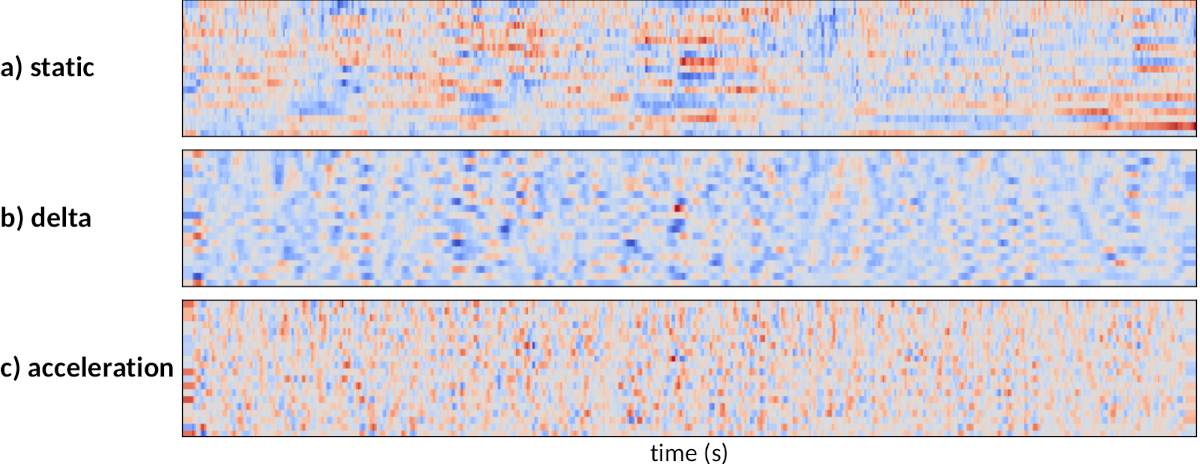
Static and dynamic feature representations.


Systems

Overview of the supervised learning process for audio content analysis. The system implements a multi-class multi-label classification approach for sound event detection task.

Overview of the recognition process for audio content analysis.
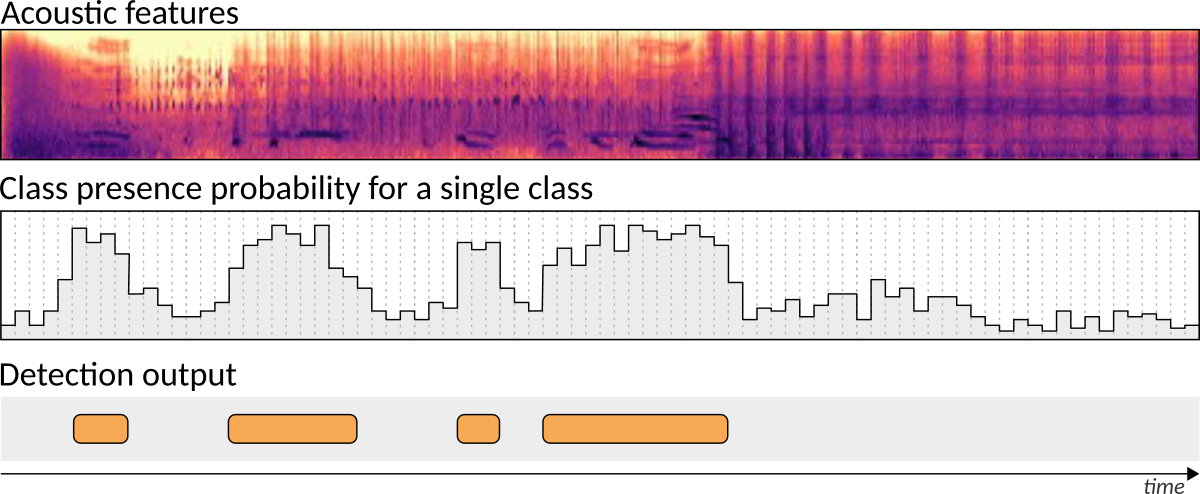
Converting class presence probability (middle panel) into sound class activity estimation with onset and offset timestamps (bottom panel).


System architectures
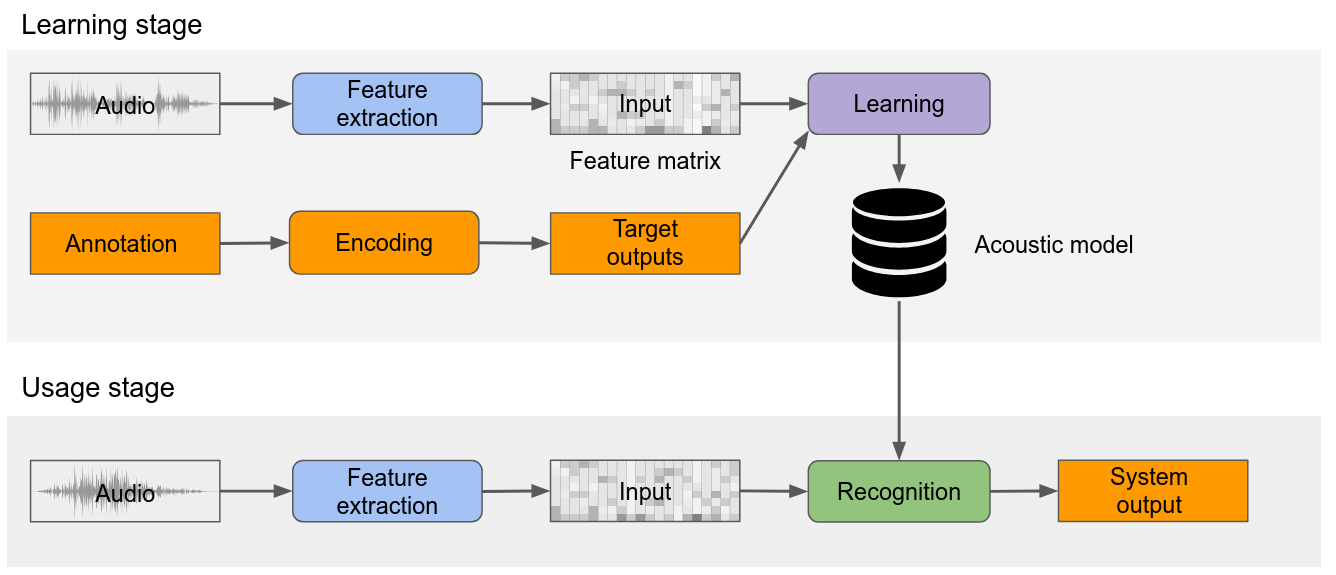
General system architecture
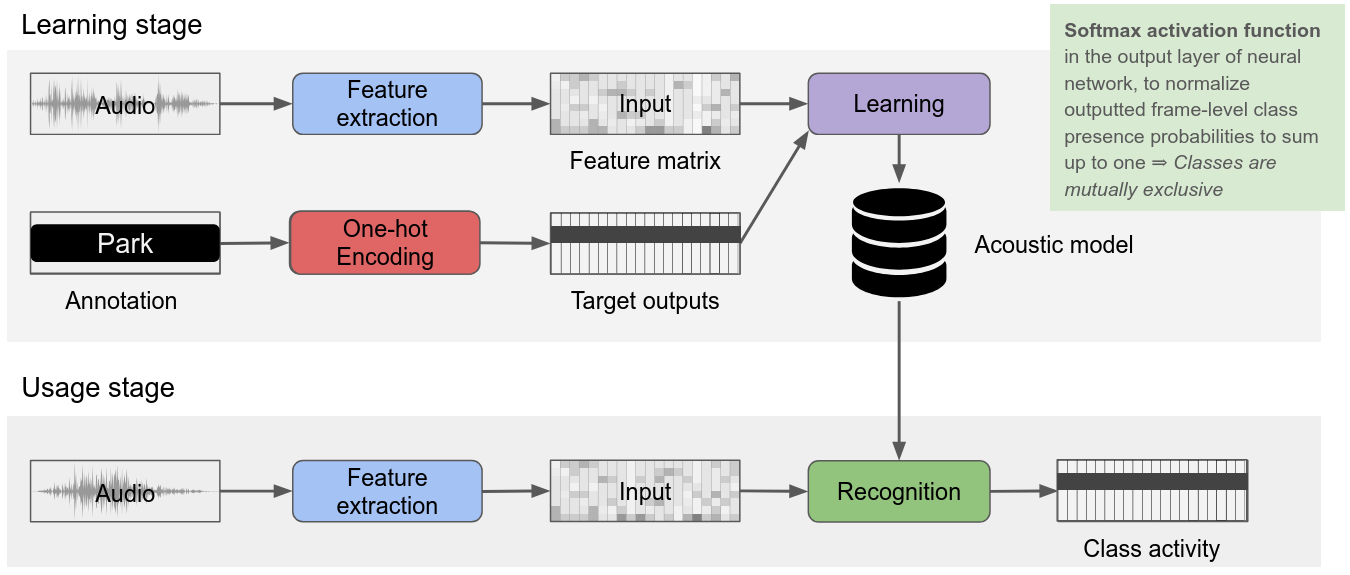
Sound classification (single label classification)
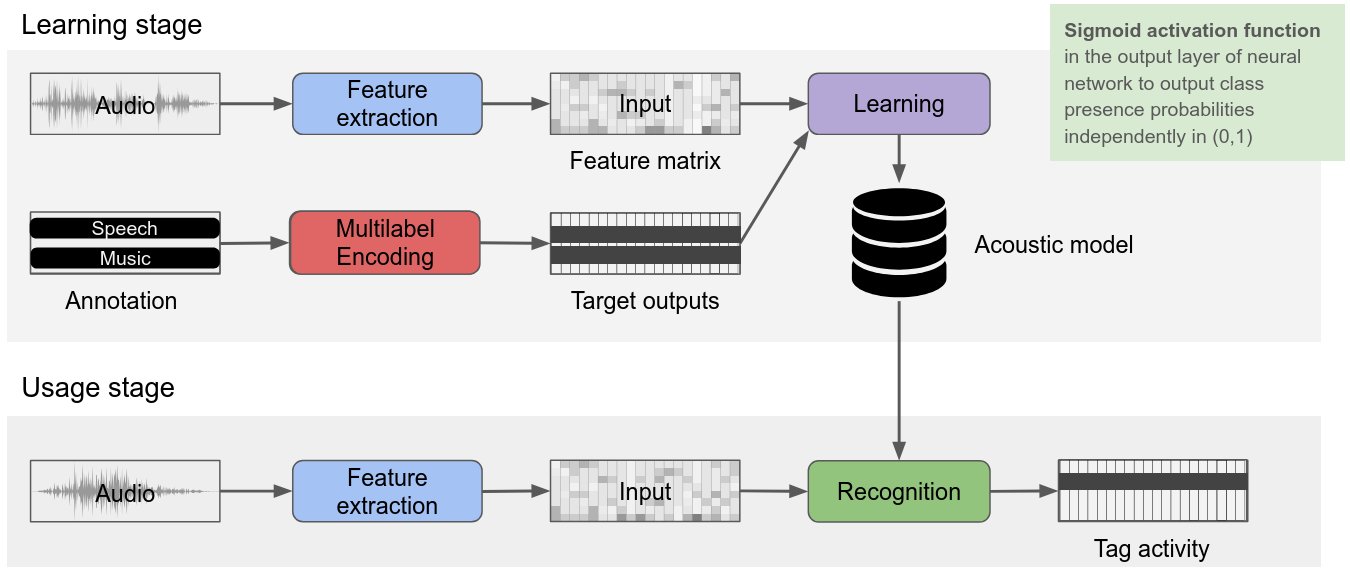
Audio tagging (multi label classification)

Sound event detection input and output
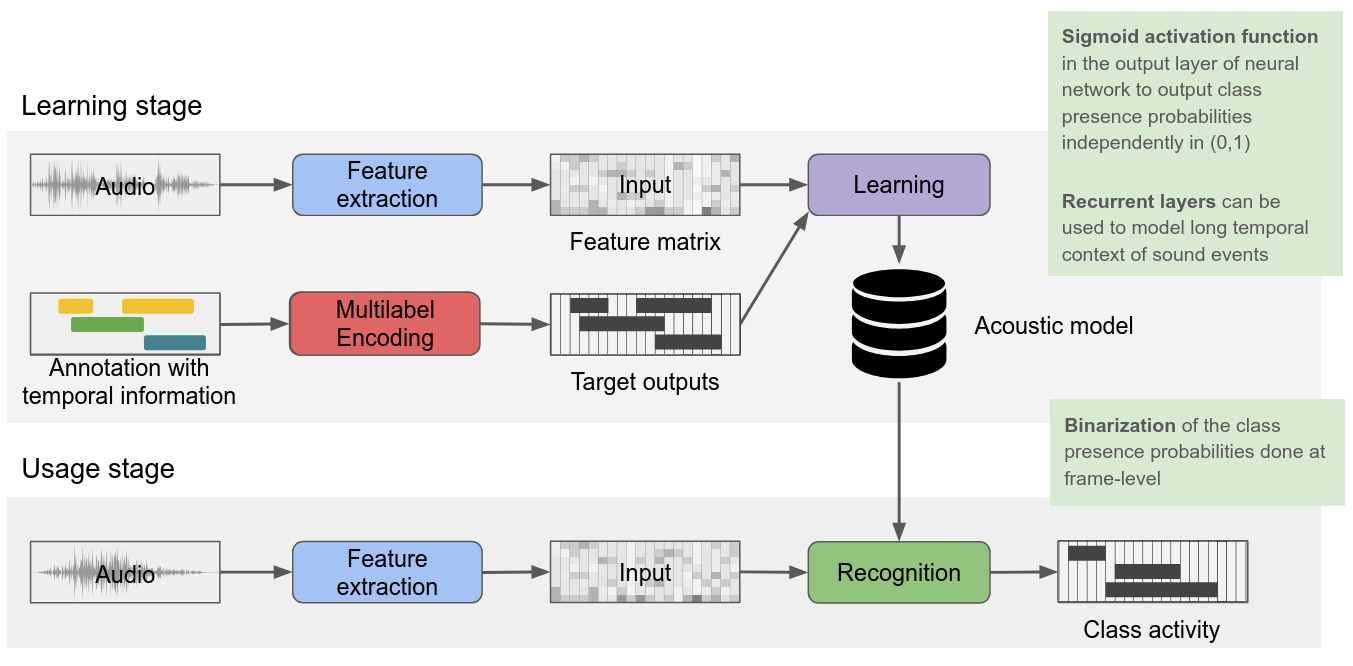
Sound event detection
GMM and HMM

Example of one-variate Gaussian distribution with four components.
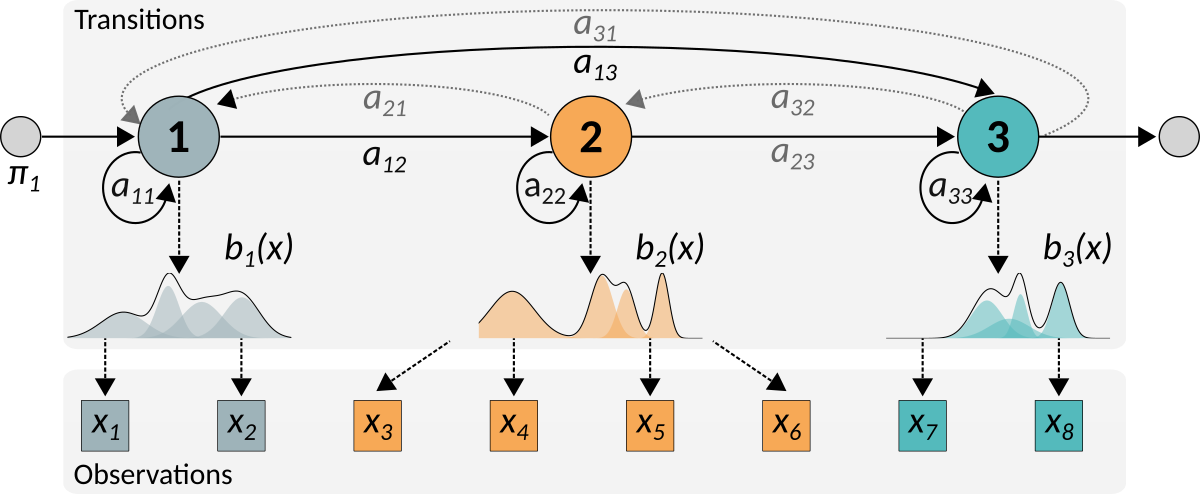
Example of a hidden Markov model. The state transition matrix is represented as a graph: nodes represent the states and weighted edges indicate the transition probabilities. Two model topologies are presented in the figure: fully-connected and left-to-right. The dotted transitions have zero-probability in the left-to-right topology.
Neural networks
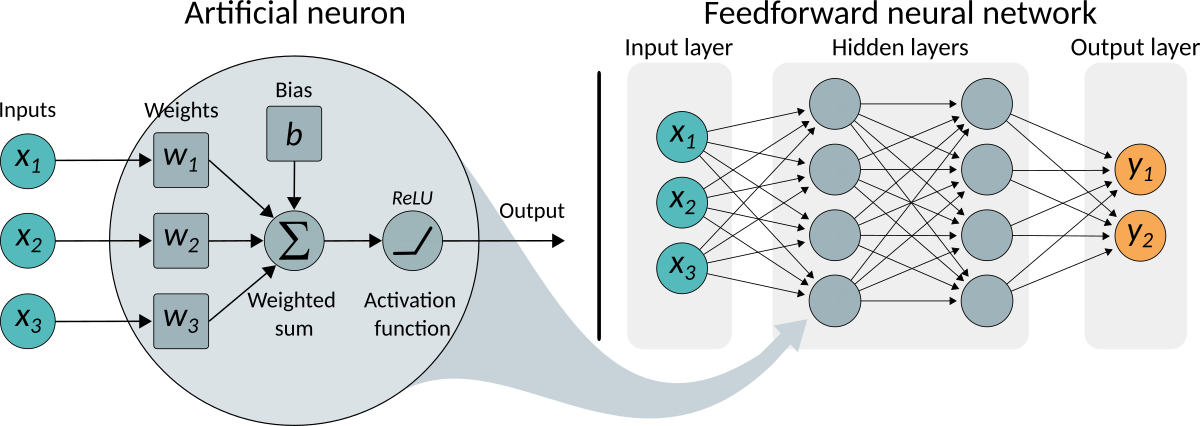
Overview of an artificial neuron (left panel) and the basic structure of a feedforward neural network (right panel).
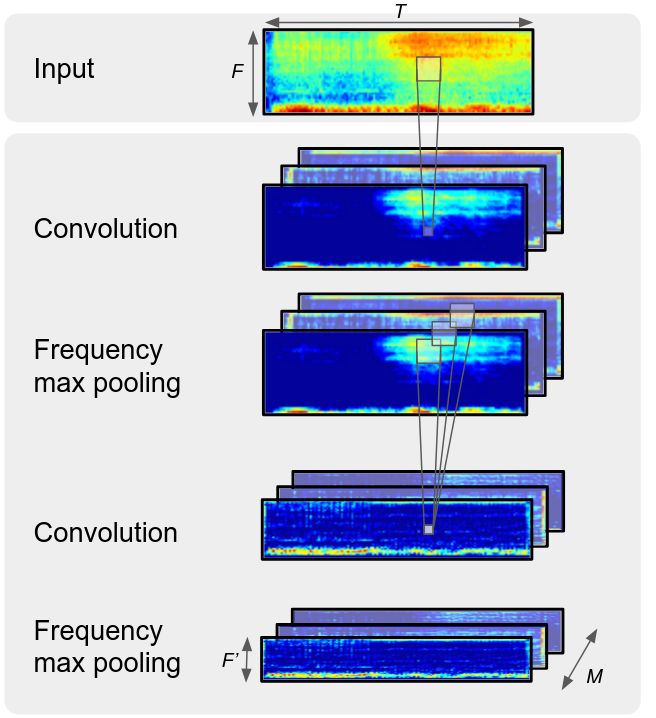
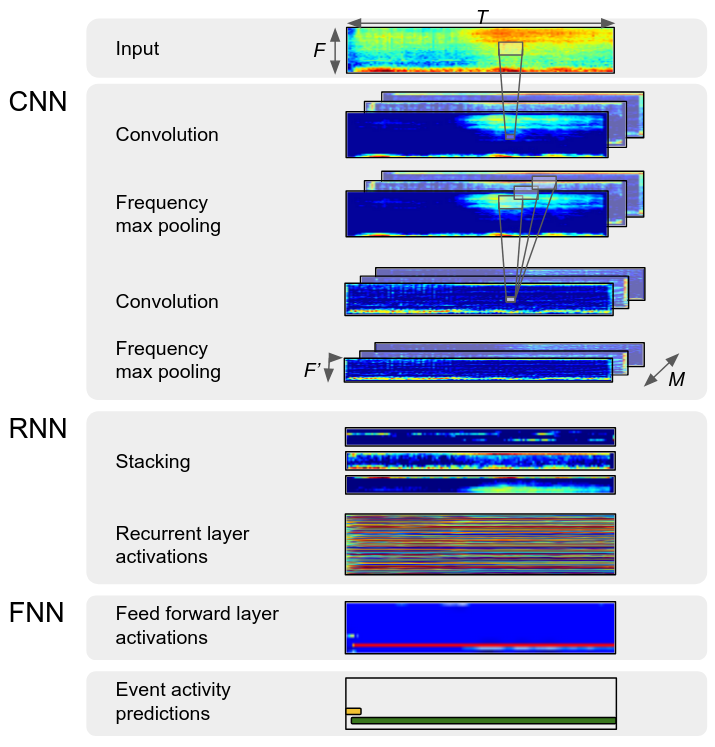
CNN
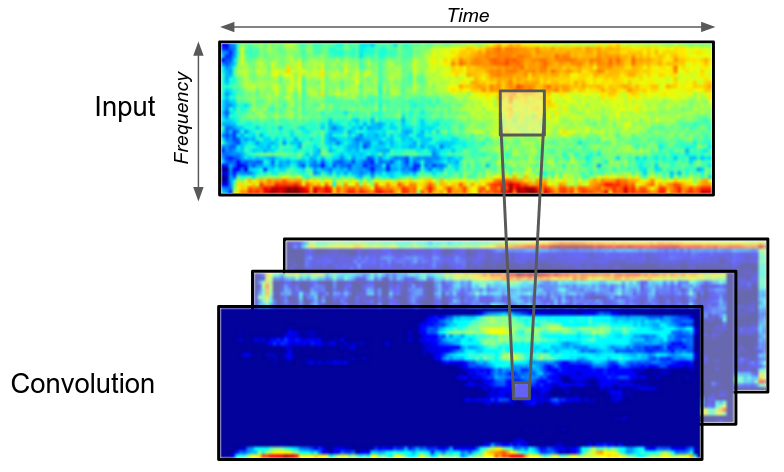
Convolutional neural networks
Multi-instance learning

Weakly supervised learning: multi-instance learning
Data augmentation
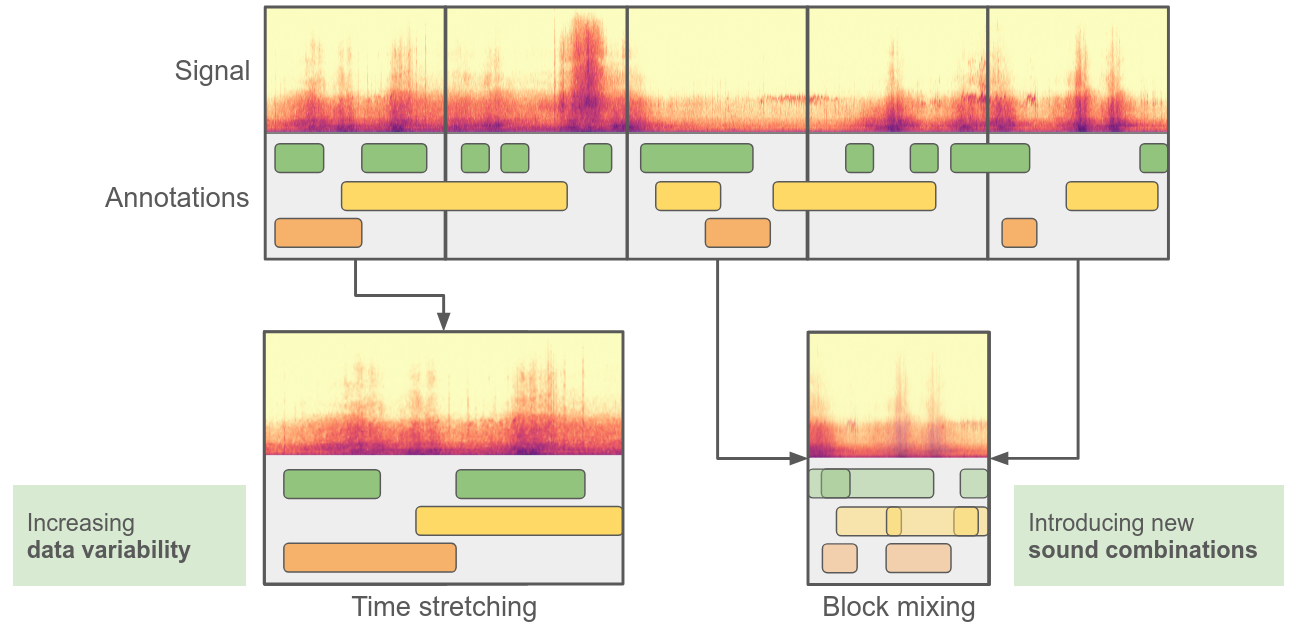
Audio data augmentation: reusing existing data
Evaluation
Segment-Based Metrics
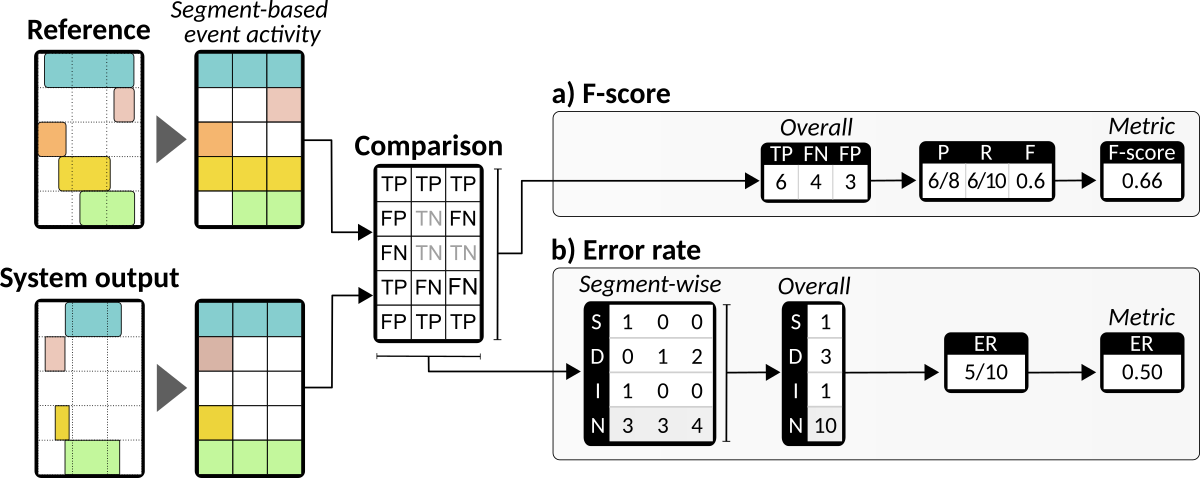
Calculation of two segment-based metrics: F-score and error rate. Comparisons are made at a fixed time-segment level, where both the reference annotations and system output are rounded into the same time resolution. Binary event activities in each segment are then compared and intermediate statistics are calculated.
Event-Based Metrics

The reference event and events in the system output with the same event labels compared based on onset condition and offset condition.
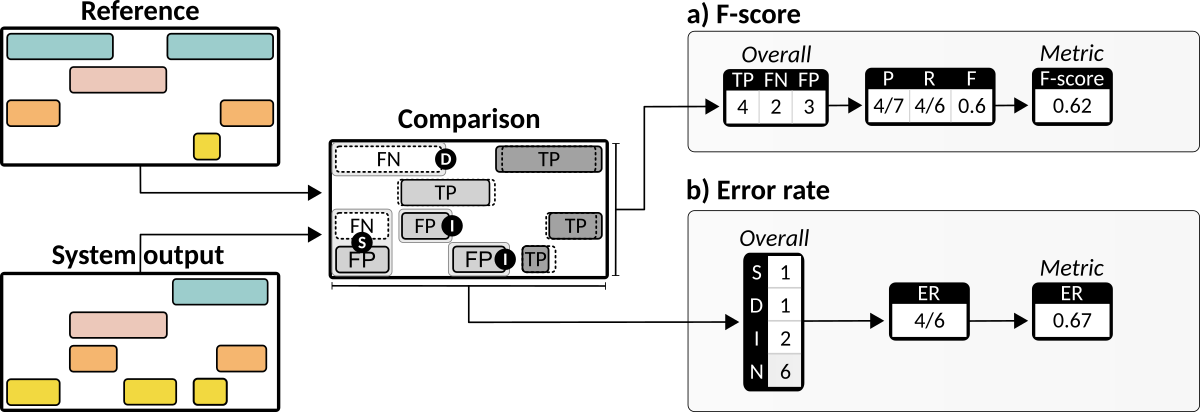
Calculation of two event-based metrics: F-score and error rate. F-score is calculated based on overall intermediate statistics counts. Error rate counts total number of errors of different types (substitutions, insertion and deletion).
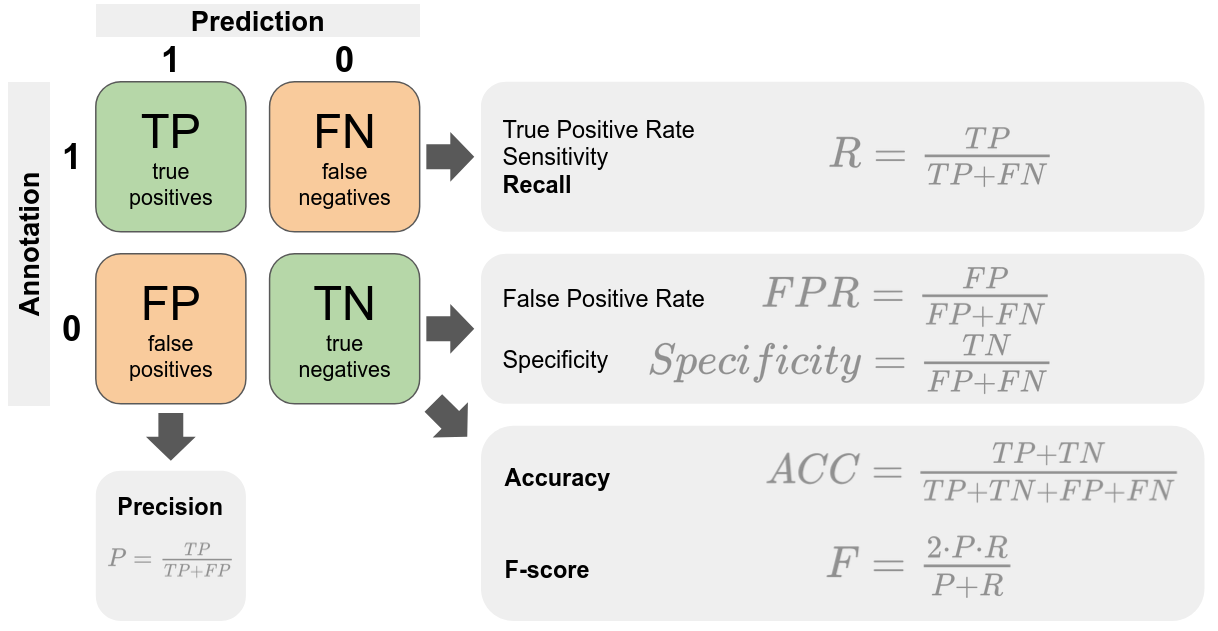
Legacy Metrics
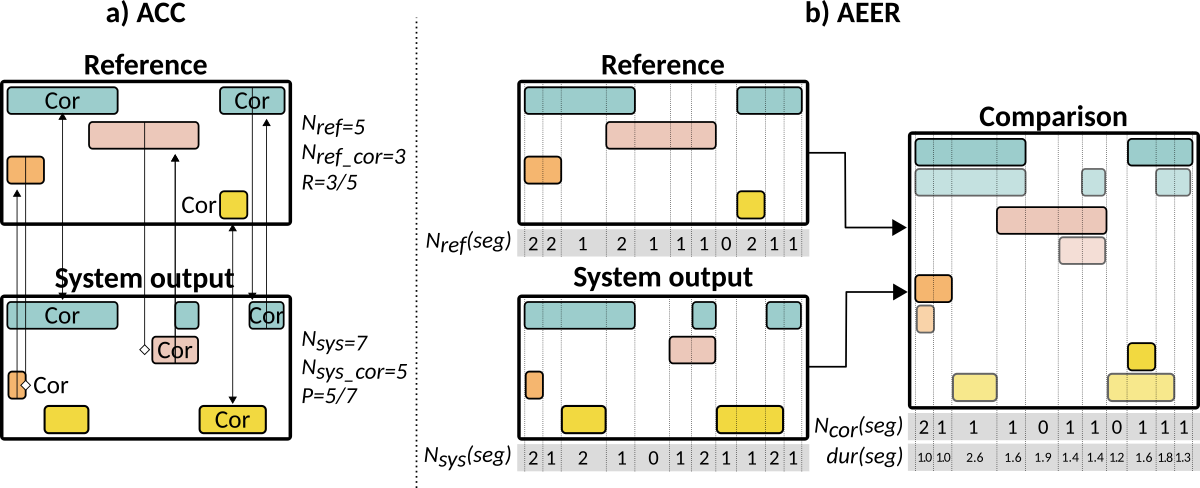
Calculation of intermediate statistics for two legacy metrics: ACC and AEER.
